THIS APPLICATION NOTE
-
Reviews the basic theory of inductors and transformers, especially as it relates to in-circuit measurements
-
Explains how to use an oscilloscope and appropriate probes to measure inductor and transformer performance during power supply operation.
-
Explains the use of inductance measurements and B-H curves to gain insight into performance.
While some of the measurements described can be set up manually, power analysis software running on the scope can provide faster setups and improved repeatability. The examples in this application note were developed using 5-PWR Advanced Power Analysis software on a 5 Series MSO oscilloscope. The 6 Series MSO with 6-PWR operates identically. Many of the inductor and transformer measurements described herein, are also available with DPOPWR Advanced Power Analysis, although the displays and controls will be different from the ones shown.
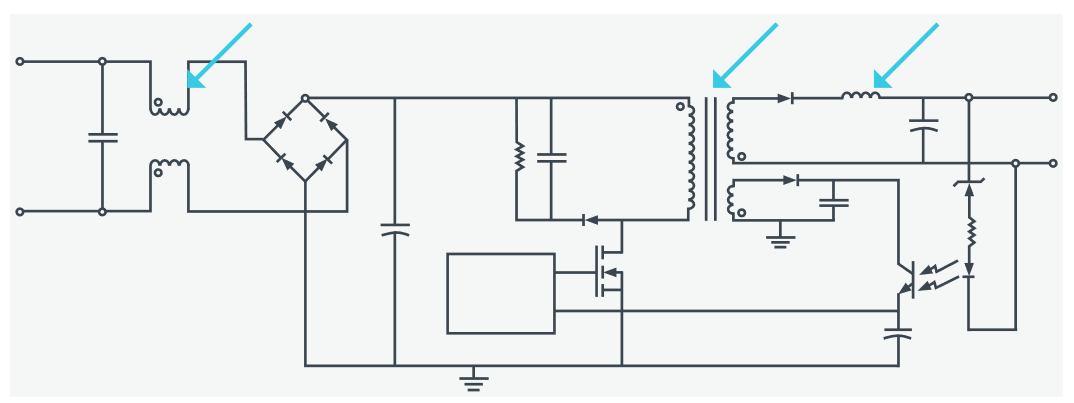
FIGURE 1. Inductors and transformers serve key roles in switch mode power supplies, including filters, step-up/step-down, isolation, energy storage, and oscillation.
Introduction
In switched mode power supplies (SMPS), magnetic components, namely inductors and transformer, play important roles. Inductors serve as energy storage devices or filters. Transformers are used convert voltage levels and to provide isolation. Transformers also play an important role in sustaining oscillation in SMPS systems. Much of the SMPS design process relies on component specifications and simulation models. However, due to actual signal conditions, parasitics, temperature and other environmental factors affecting the magnetic component’s performance, a power supply may not perform exactly as predicted by the datasheet specs and simulations. Thus, in-circuit measurements of inductors and transformers, made under operating conditions, can provide important information.
A Quick Review of Inductor Theory
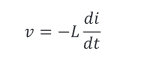
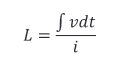
Faraday's and Lentz's laws tell us that the current through an inductor and the voltage across the inductor are related as:
This shows that inductance can be thought of as the extent to which a changing current results in an opposing voltage. By integrating, rearranging,and ignoring the sign, we can get
This shows that inductance may be determined as a function of voltage and current over time.This is a perfect job for an oscilloscope equipped with a voltage probe, current probe, and able to perform integration and plot X versus Y
In contrast to a theoretical inductor, the inductance value of a real inductor is dependent on current levels, temperature and frequency of operation. In a power supply, these characteristics vary in real time with operating conditions.
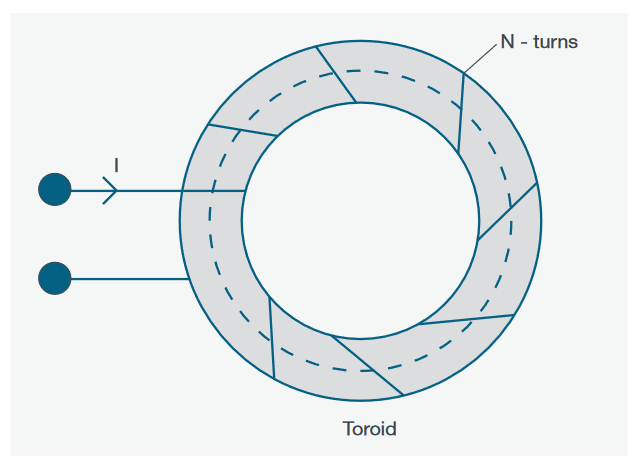
FIGURE 2. A basic inductor – a coil wound on a closed ferromagnetic core. Current of I amperes flows through the coil which has N turns. The inductance of the coil describes the relationship between the current flowing in the coil and the magnetic flux
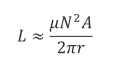
As an example, the inductance of the toroid in Figure 2 may be approximated by
Where:
µ is magnetic permeability of the core
N is the number of turns of wire on the toroid
r is the radius of the core from the dashed center-line in cm
A is the cross-sectional area of the core in cm2 (assumed to be small relative to the radius of the toroid)
Since this number of turns is squared, this is the biggest contributor to inductance. The permeability of the core material also plays a significant role.However, the value of the inductance is also related to the physical size of the component. To minimize the size of the inductor, most inductors in electronics use core materials which have a much higher permeability than air.
In short, the characteristics of the core material and geometry are critical in determining inductance over various operating conditions, as well as power loss in the device.
Inductance Measurements and I vs. ∫V
Power supply designers often use simulation techniques to determine the appropriate inductor value for a design. After manufacturing the inductor, it is common practice to verify the inductance using an LCR Meter. However, most LCR meters stimulate the component with sinusoids over a narrow frequency range, so while this is a good technique for confirming that the component is roughly the correct value, it is a poor predicter of in-circuit performance.
The inductance characteristics of an inductor are dependent upon the current and voltage source excitation signal, wave shape, and frequency of operation, which may vary in real-time operating conditions. Therefore, it is desirable for designers to be able to measure and observe the behavior of an inductor in the dynamically changing environment of the power supply. Tektronix Advanced Power Analysis software (such as 5-PWR) automates this measurement.
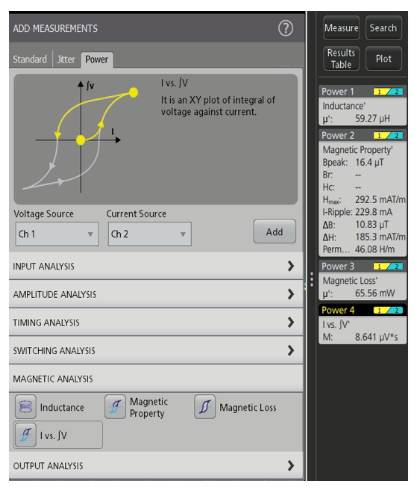
FIGURE 3. Specifying voltage channel and current channel to set up inductance and i vs. ∫v measurements.
MAKING THE MEASUREMENT
Measurements are made by probing the voltage across the device,usually with a differential voltage probe. A current probe is usually used to measure the current through the magnetic component.
To determine inductance the application integrates the voltage over time and divides by the change in current. It removes any DC offset and uses averaging to calculate the inductance value.
Note on Making Inductance Measurements on Transformers and Coupled Inductors
When you are measuring the inductance of a transformer, do not load the secondary winding. Measuring inductance at the primary winding under a no-load condition is equivalent to measuring the inductance for a single winding inductor. When you are measuring the inductance of the coupled inductor with multiple windings on the same core, the measured value of the inductance will deviate from the actual value, due to the influence of the current on the other winding/s.
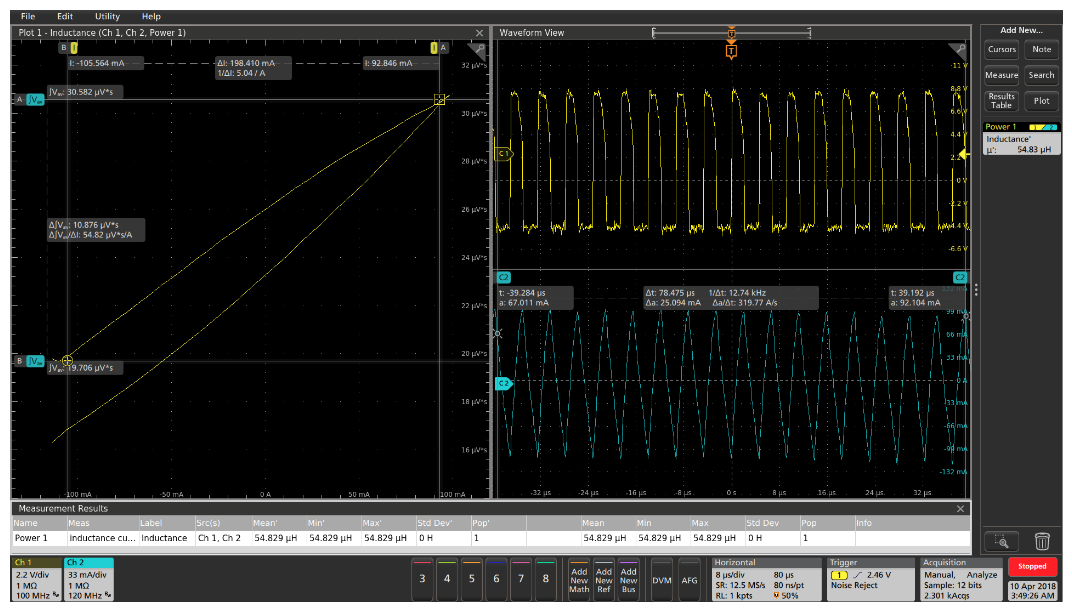
FIGURE 4. Inductance measurement gives the average inductance value in Henries. The yellow waveform (CH1) is the voltage across the inductor and the blue waveform (CH2) is the current through the inductor. The plot on the left shows current, i versus ∫vdt, the slope of which is inductance.
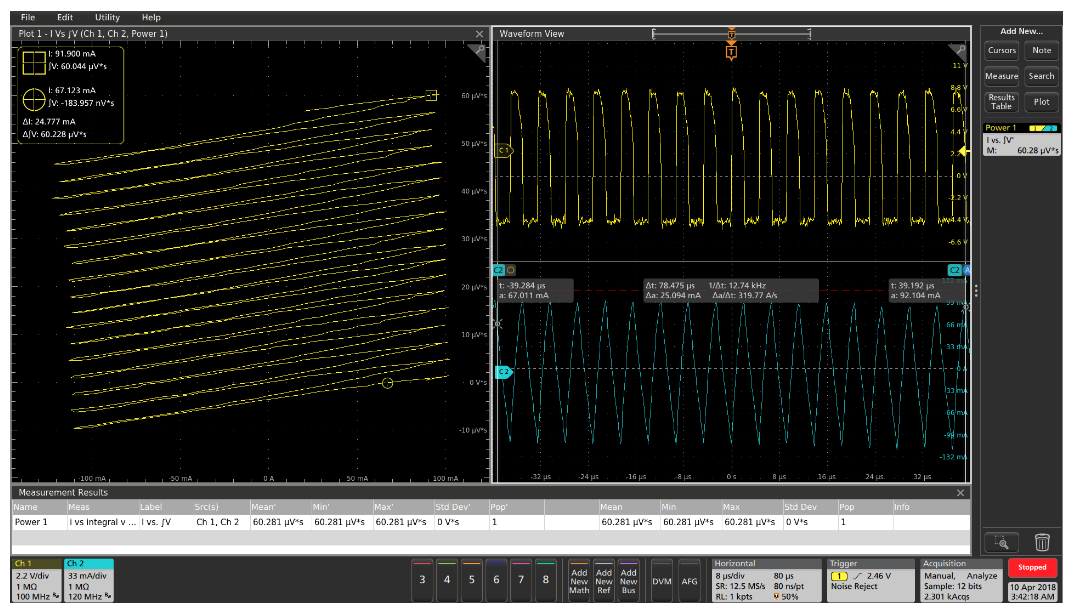
FIGURE 5. I vs ∫V measurement gives additional insight on inductor performance. Designers can see any DC bias building up over multiple cycles. The yellow waveform (CH1) is the voltage across the inductor and the blue waveform (CH2) is the current through the inductor.
B-H Curve Measurements
Magnetic power supply components are designed for expected operating voltage, current, topology, and the particular type of power converter. The operating regions of inductors and transformers help determine the stability of a switch mode power supply. However, power supply operating characteristics can vary during power-on, steady state operation, load changes and environmental changes, making it extremely difficult to consider all possible scenarios during the design process.
Thus, to ensure the stability of the power supply, it is important to characterize the operating region of a magnetic component while it operates in the SMPS. Generally, the goal is to avoid saturation and operate in the linear region of the hysteresis curve. However, it is extremely difficult to design a magnetic component and ensure that it will operate in a linear region under all conditions.
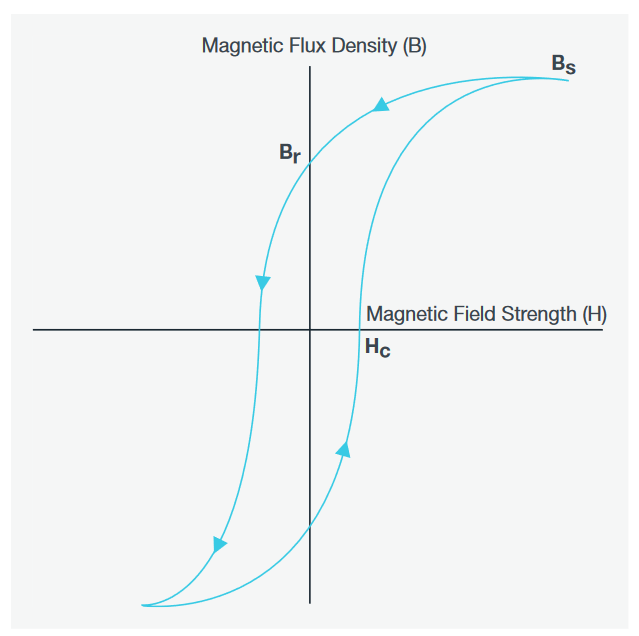
FIGURE 6. Typical B-H curve, or “hysteresis curve”. Manufacturers of core material may provide such a hysteresis curve as part of their specifications.
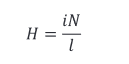
To help visualize the performance of an inductor and its core, designers use B-H curves like the one shown in Figure 6. On this curve, H,measured in A/m, is the magnetizing force in the device. It is measured in Amperes/meter and it is proportional to the current.
The resulting flux density, B is proportional to the integral of the voltage across the device. Magnetic flux density B,measured in units of Tesla, is the strength of the magnetic field.It determines the force that is exerted upon a moving charge by the magnetic field.
From this curve we can see:
-
Permeability, µ. Measured H/m. This is a characteristic of the core material, and it is the rate at which magnetizing force H (driven by current) produces flux density B (integrated voltage). It is the slope of the B-H curve.Designers use high permeability material to enable physically smaller inductors and transformers.
-
Saturation flux density. The point at which additional magnetizing force, H stops producing incremental flux density, B. Designers avoid saturation in most power supply applications.
-
Hysteresis characteristics. Hysteresis is the “width” of the curve and indicates loss in power supplies. Most designs seek to use magnetically “soft” core materials to minimize these characteristics.
-
- Remanence, Br. The magnetic flux density that remains in the material after the magnetizing force, H, drops to zero
-
- Coercive Force, or Coercivity, Hc. The value of H required to drive the flux density, B, to zero.Indications of potential instability include:
-
Measured peak flux density close to the saturation flux density specified by the core datasheet indicates that the component is getting close to the saturation
-
A BH curves that changes from cycle to cycle, indicating saturation. In a stable/efficient power supply the BH curve will have a symmetrical return path and will trace this path consistently.
An oscilloscope can be used to performs an in-circuit measurement of voltage across, and current through, the winding of an inductor.
Given the number of turns in the device, the magnetic length of the device, and the cross-sectional area of the core, it is possible to derive the actual B and H values based on realtime voltage and current measurements. From the plotted curve, one can derive the saturation flux density, remnant flux density, permeability and coercivity
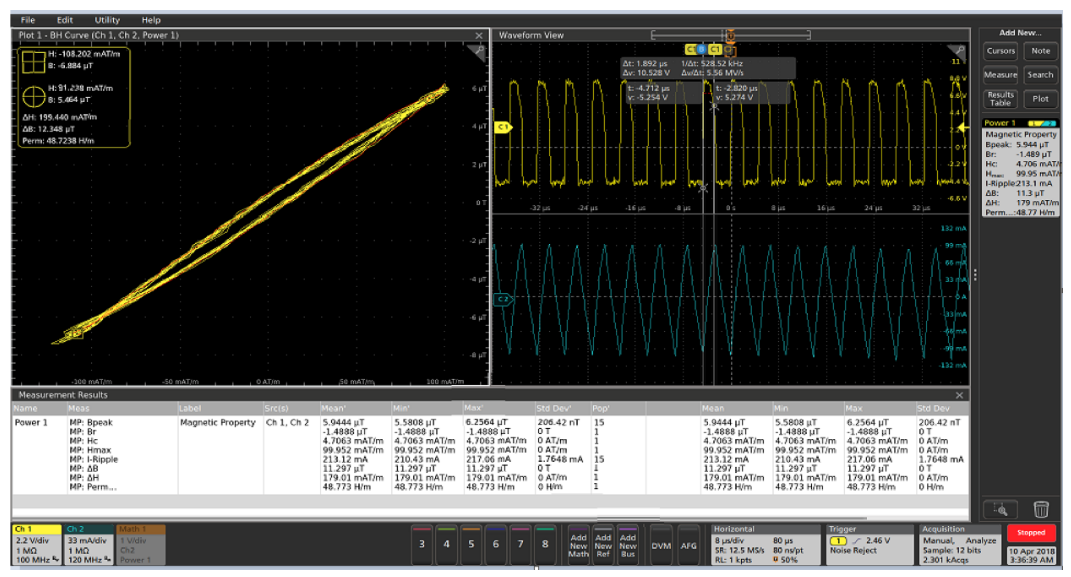
FIGURE 7. 5-PWR Magnetic Property measurement gives Hysteresis plot of the magnetic component in the design to check if the magnetic components are at saturation or not as this leads to instability of the Power Supply.
MAKING THE MEASUREMENT
To generate a B-H plot, the voltage across the magnetic element and the current flowing through it are measured. In the case of a transformer,the currents through the primary as well as secondary windings are of interest.
A high-voltage differential probe is connected across the inductor or primary winding of the transformer. A current probe measures the current through the inductor or primary. Current probes are also used to measure the current through the secondary windings, if needed.
In order to analyze the B-H curve with power analysis software, several pieces of information must be provided in the configuration panel:
-
Number of turns (N)
-
Magnetic path length (l)
-
Cross-sectional area (Ae)
The power analysis software can then calculate the magnetizing current using the data from oscilloscope channels where the current probes are connected.
The magnetic property results are presented as shown in Figure 11.
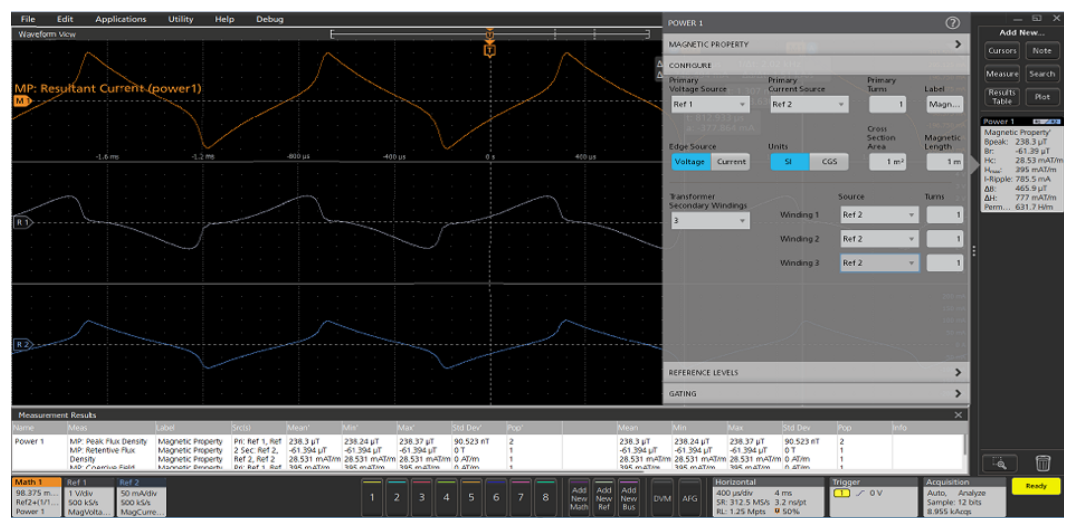
FIGURE 8. Magnetic measurements on multi secondary winding transformer. The Ref1 (white) waveform is the voltage across the inductor and the Ref 2 (blue) waveform is the inductor current. The math wfm (orange) which is the resultant current wfm is created when the user configures to test multiple secondary windings.
Measurement results
-
Permeability: The degree of magnetization of the material
-
Bpeak: The maximum magnetic flux density induced in a magnetic component
-
Br: The point on the curve where H = 0 but B still has a positive value. This is known as the Remanence of the component, a measure of its Retentivity. The higher the remanence, the more magnetization the material will retain.
-
Hc: The point on the curve where B = 0 and H is a negative value. This represents the external field required to cause B to reach zero. This value of H is known as the coercive force. A small coercive force value means that the component can be demagnetized easily.
-
Hmax: The maximum value of H at the intersection of the H-axis and the hysteresis loop
-
I-ripple: The peak-to-peak value of the current
B-H CURVES FOR TRANSFORMERS
To measure the magnetic characteristics of a transformer under operating conditions, care must be taken to account for current being transferred into the secondary. When measuring the B-H curve on a transformer, it is helpful to consider a theoretical element call the “magnetizing inductor”. Let’s look at commonlyused multiple-secondary transformer and its equivalent circuit.
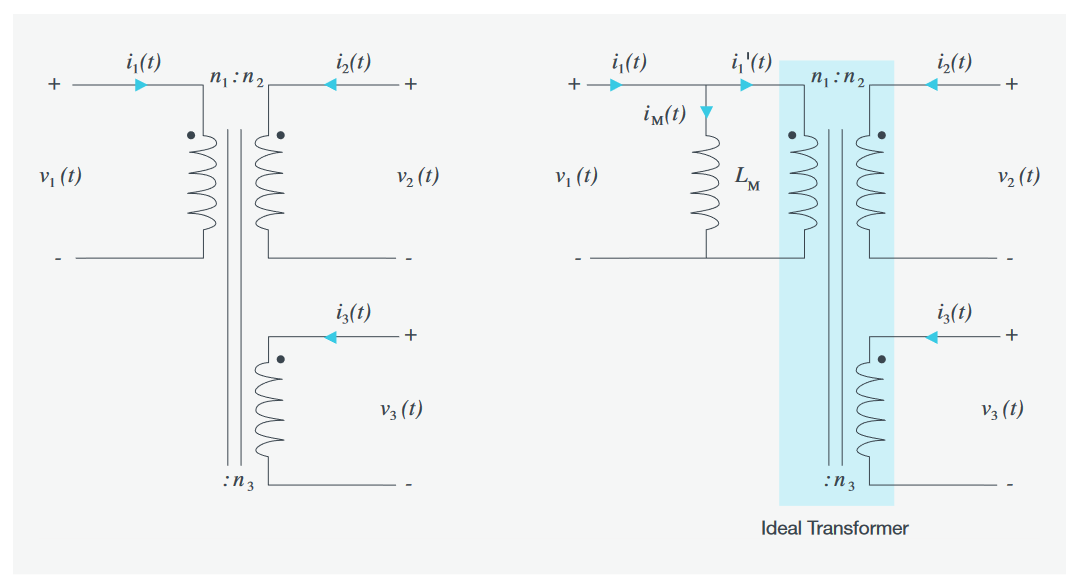
FIGURE 9. Transformer schematic (left) and equivalent circuit (right) showing magnetizing current flowing through an imaginary inductor, LM in parallel with the primary. LM models the magnetic characteristics of the transformer.
The magnetizing current is the current that would flow through the primary of the transformer when the secondary is open (unloaded). In other words, the magnetizing current does not produce any current in the secondary. As shown in Figure 9, transformers are modeled with this magnetizing current flowing through a “magnetizing inductor” across the primary.Generally, this is used to model the magnetization characteristics of the core material.
5-PWR software includes the ability to measure the current in transformer secondaries and performing math to isolate the magnetizing current and present an accurate B-H curve of a transformer under operating conditions.
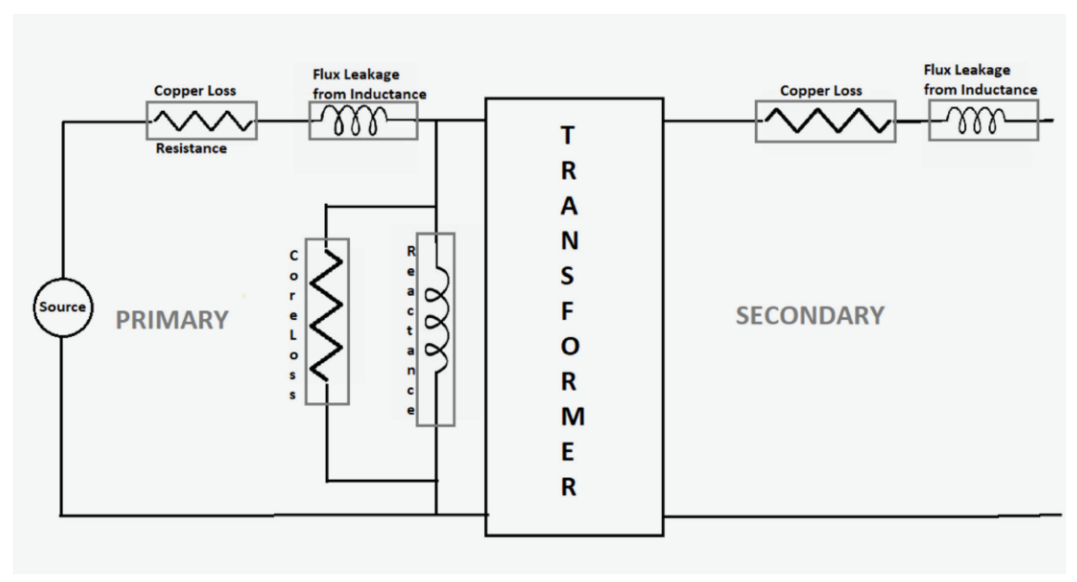
FIGURE 10. Transformer losses may be modeled as a combination of linear elements.
Loss Analysis
Losses in magnetic components are significant contributors to overall loss in a power supply. Figure 10 shows the major elements determining loss in magnetic components:
-
Core loss depends on the magnetic properties of the material and includes hysteresis loss and eddy current loss
-
Copper loss due to the resistance of the windings. It also depends on the load connected to the secondary side of a transformer
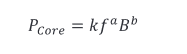
A number of techniques exist for estimating core loss. One such technique is the Steinmetz empirical formula which, relates core loss to frequency and flux density:
where k, a, and b are constants for the core material, generally take from the core manufacturer’s datasheet. Datasheets may also give loss estimates at various frequencies and flux densities; however, these are typically given in response to sinusoidal excitation.However, in power applications, components are usually driven with non-sinusoidal stimuli, causing uncertainty in such approximations.
The 5-PWR analysis software measures total magnetic loss. It is computed by average power of voltage and current waveforms, average (v(t) ∙ i(t)). The total magnetic loss includes both copper loss and core loss.
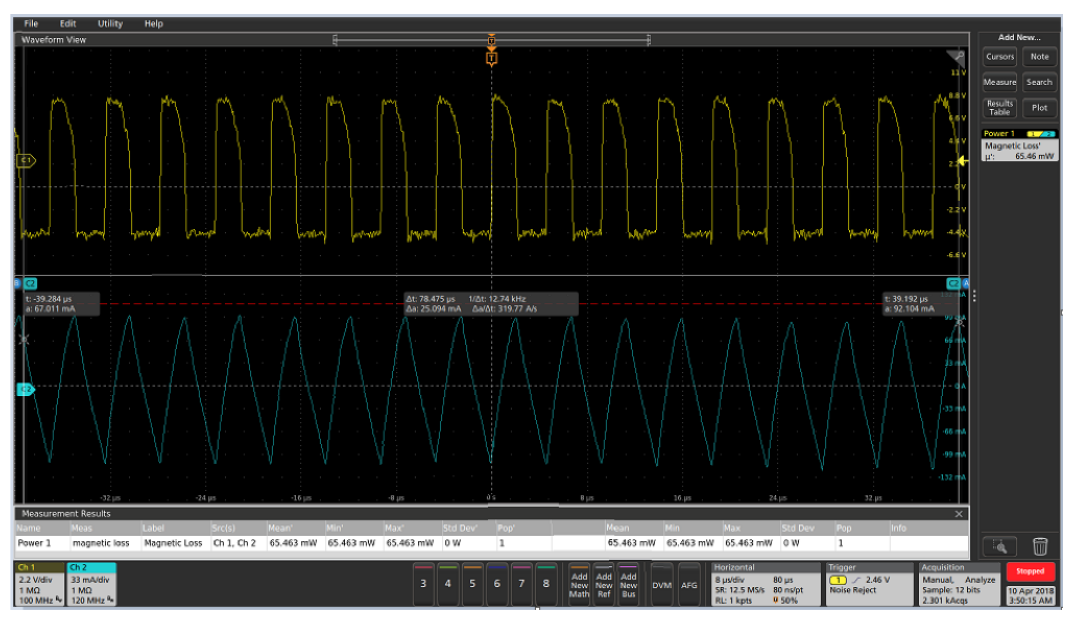
FIGURE 11. 5-PWR Magnetic Loss measurement gives the Total Magnetic Loss which includes the Core Loss and Copper Loss. Designers can find the Core Loss from the component manufacturer’s data sheet and derive the Copper loss by subtracting the Core loss from the Total Magnetic loss.
MAKING THE MEASUREMENT
5-PWR is capable of calculating the magnetic loss in a single winding inductor, a multiple winding inductor, or even a transformer. In the case of a single-winding transformer, a differential probe is connected to measure the voltage across the primary winding. A current probe measures the current through the transformer. The power measurement software can then automatically calculate the magnetic power loss.
The magnetic power loss results are presented as shown in Figure 11. It shows the total power loss in the magnetic component.



 400-616-5217


 Vị trí hiện tại:



 粤公网安备 44030502008393号